The Scenario

The Northwestern Campus police receive a 911 call at 11:45am on a Friday night in October originating from an off-campus location South of Noyes Street and West of Sherman Avenue. Can a machine learning model help the officers predict the nature of the emergency even before they speak to anyone on the phone?

Abstract

Machine Learning on the Northwestern Campus Police Blotter

NU Blotter's task is to predict the incident type of Northwestern Campus blotter entries using the time and location of the incident. This simulates what a real-time system to classify 911 calls would have to do. This kind of system would be useful to the police officers because it could allow them to respond to 911 calls faster and with more specificity. In addition, this model can be used to better understand the patterns in police incidents around campus. In particular, better understanding of crimes commonly associated with students, such as alcohol law violations and noise complaints, could help improve relations between Northwestern students and Evanston residents.

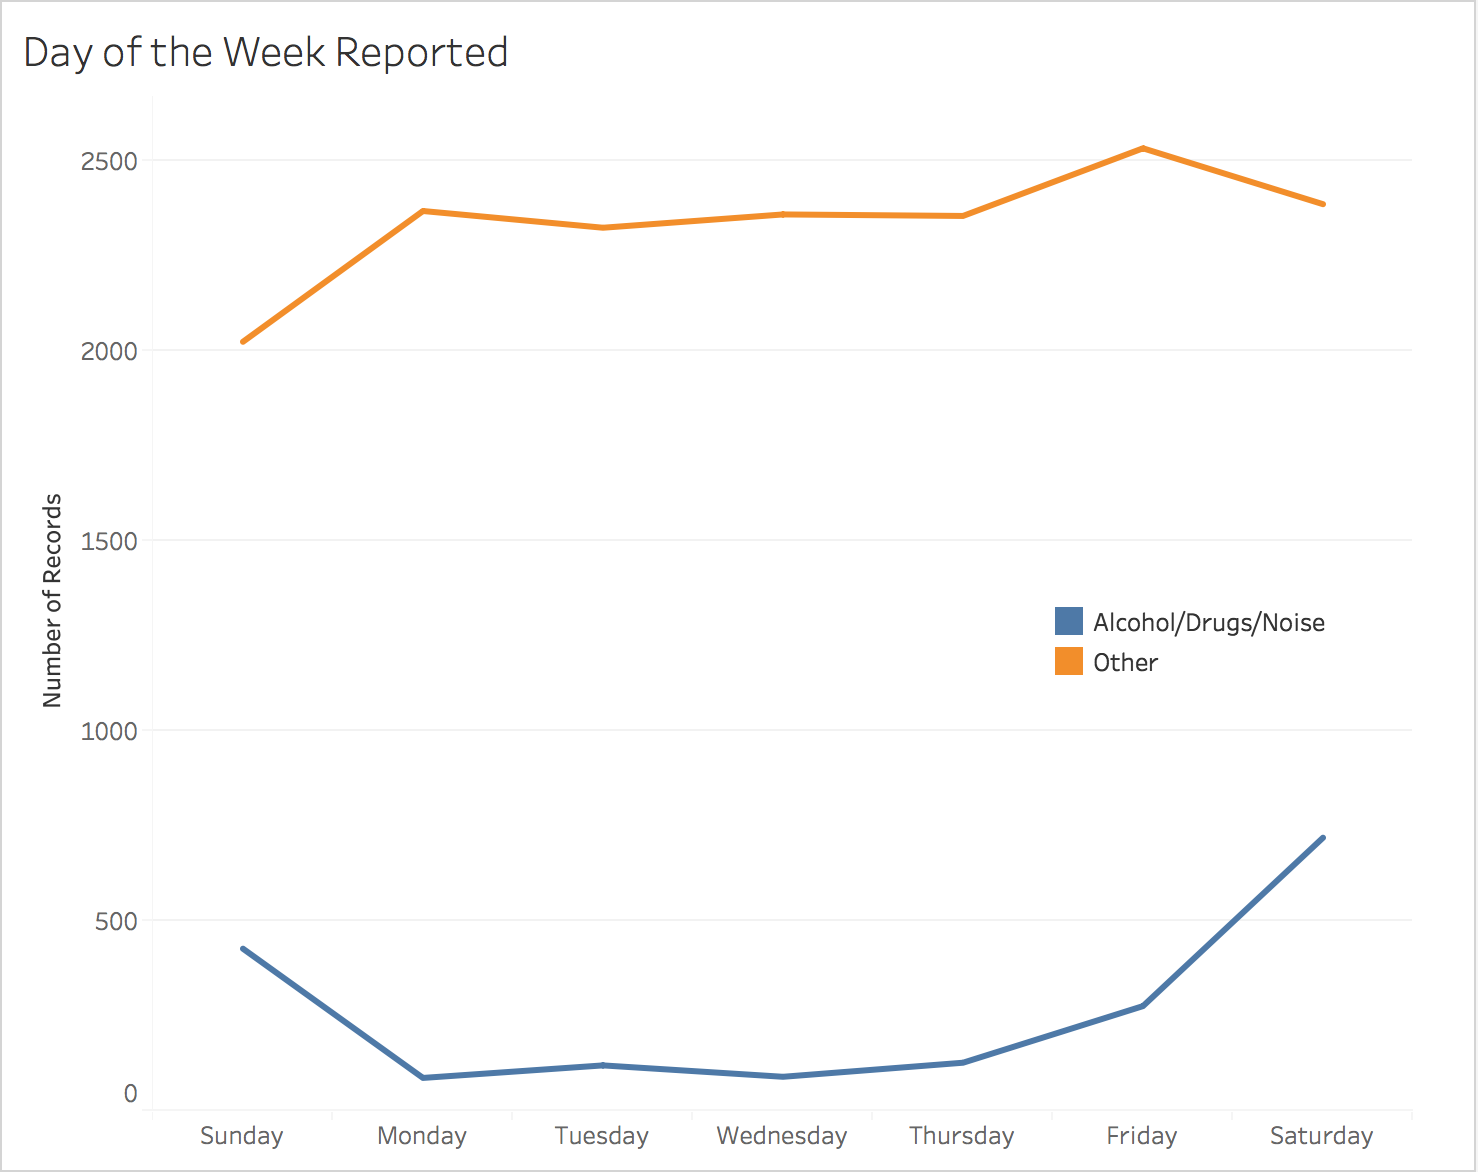
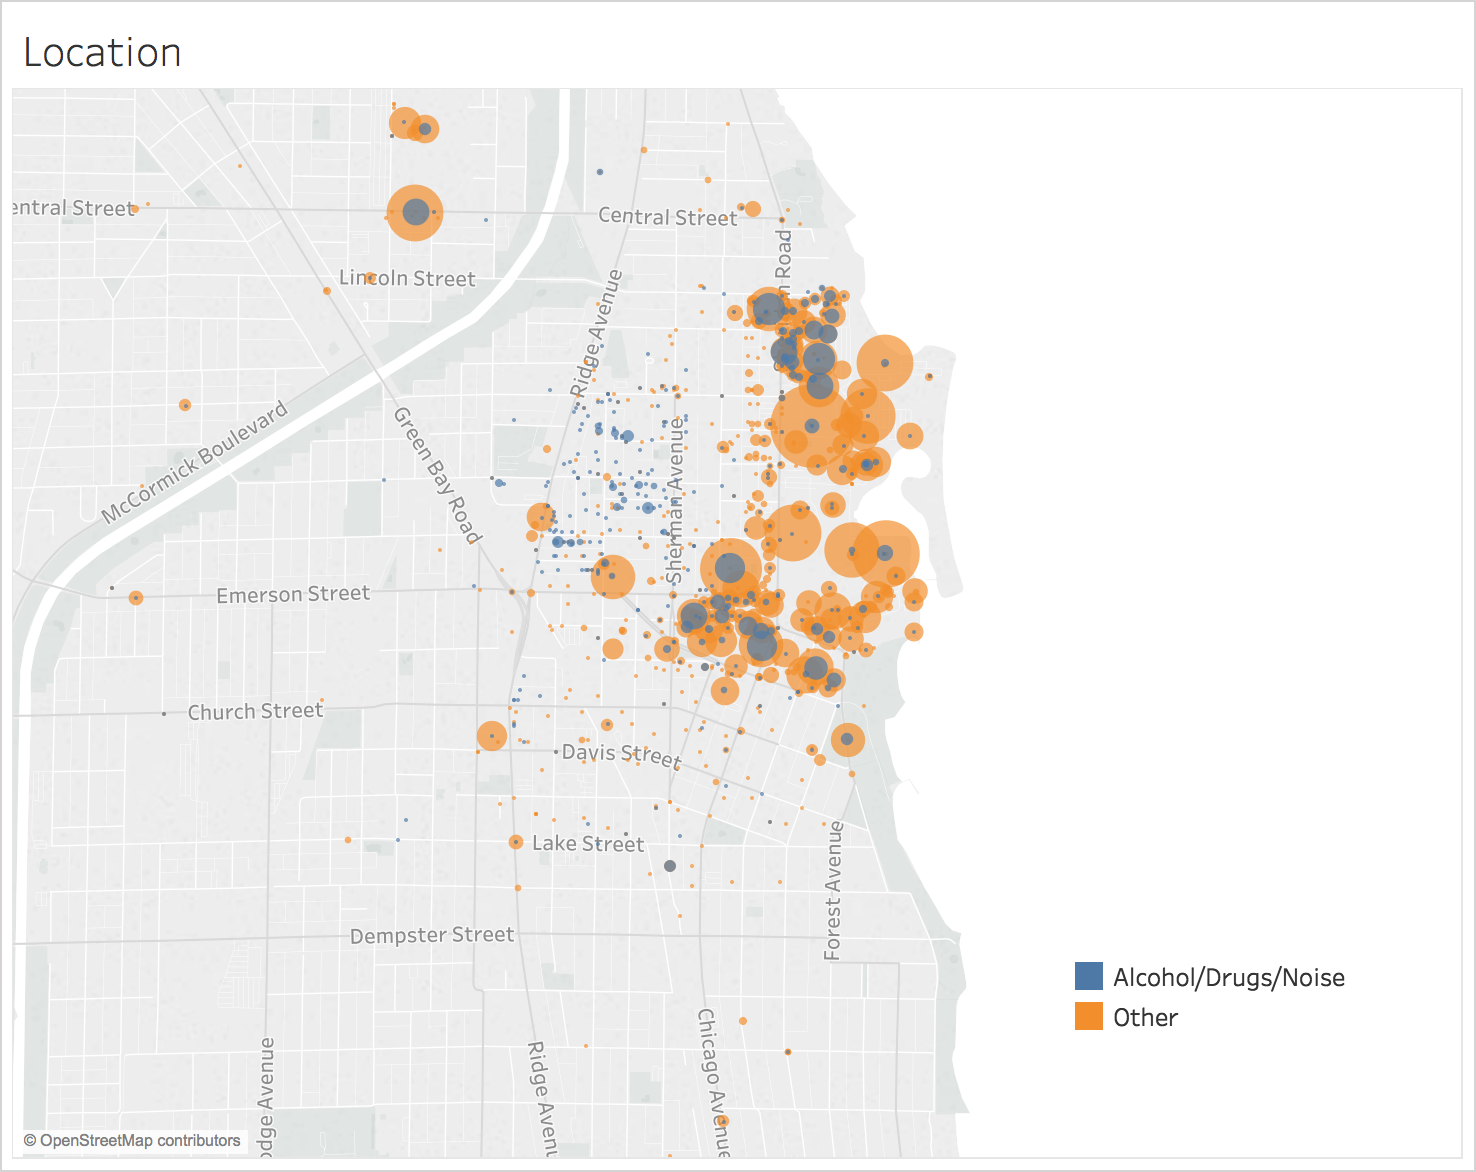
Location of Incidents by Day of the Week
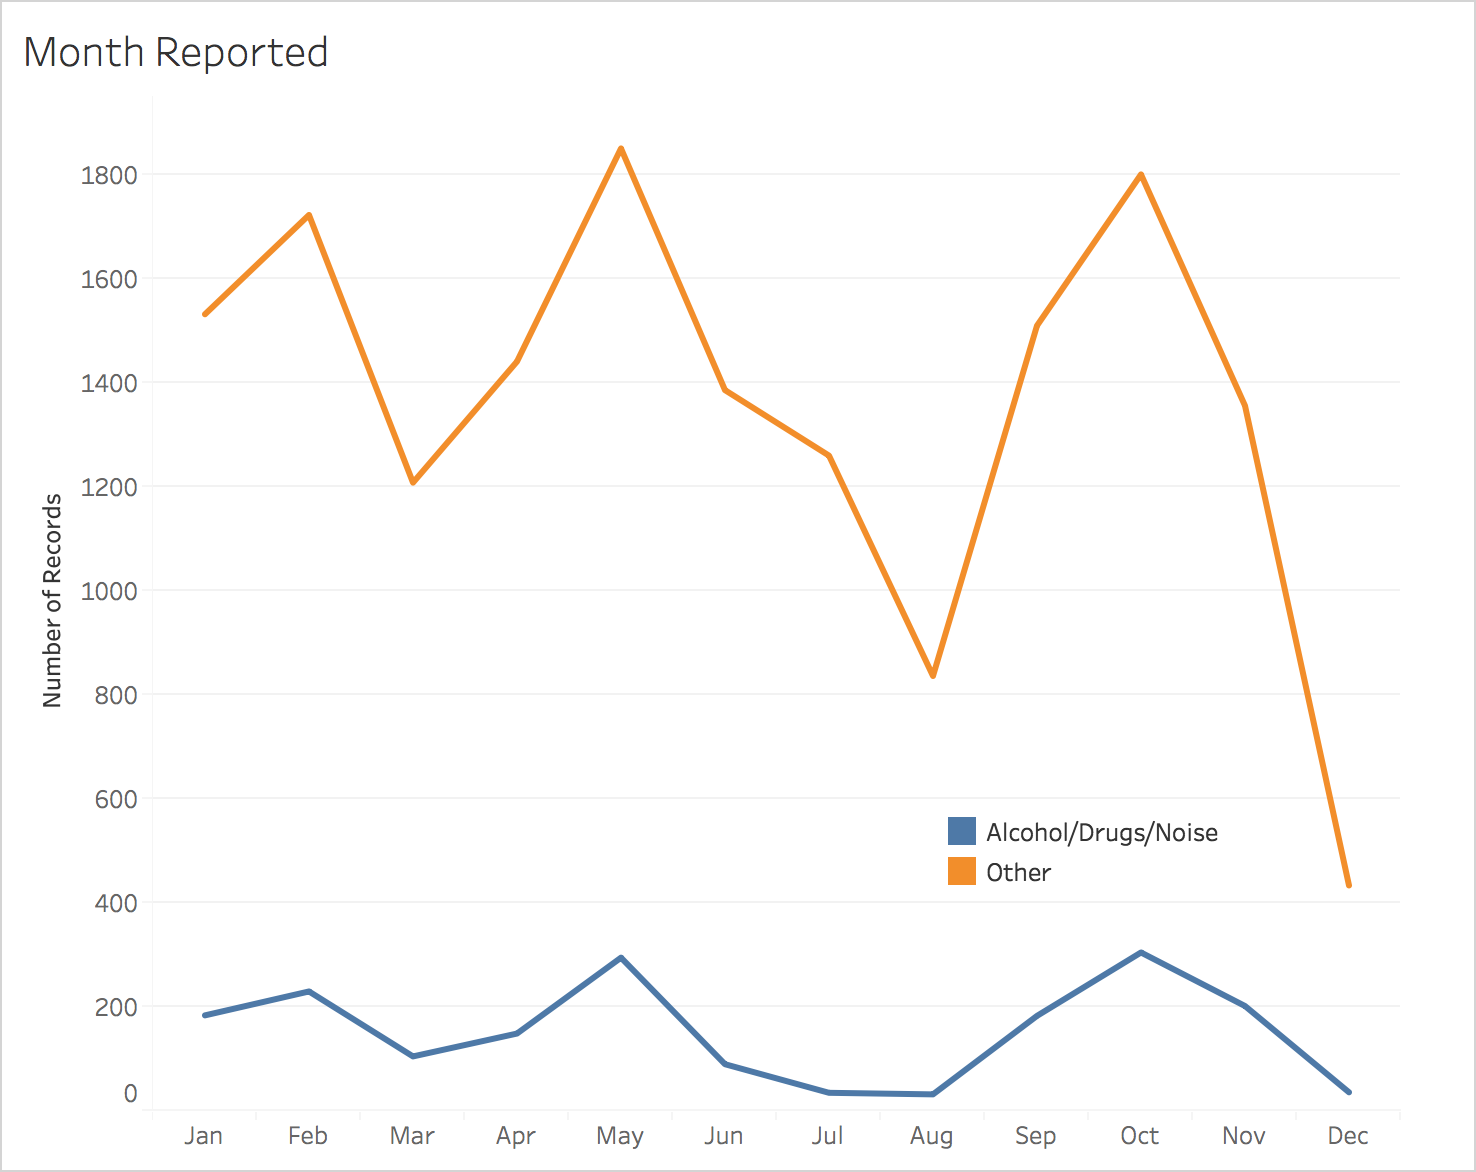
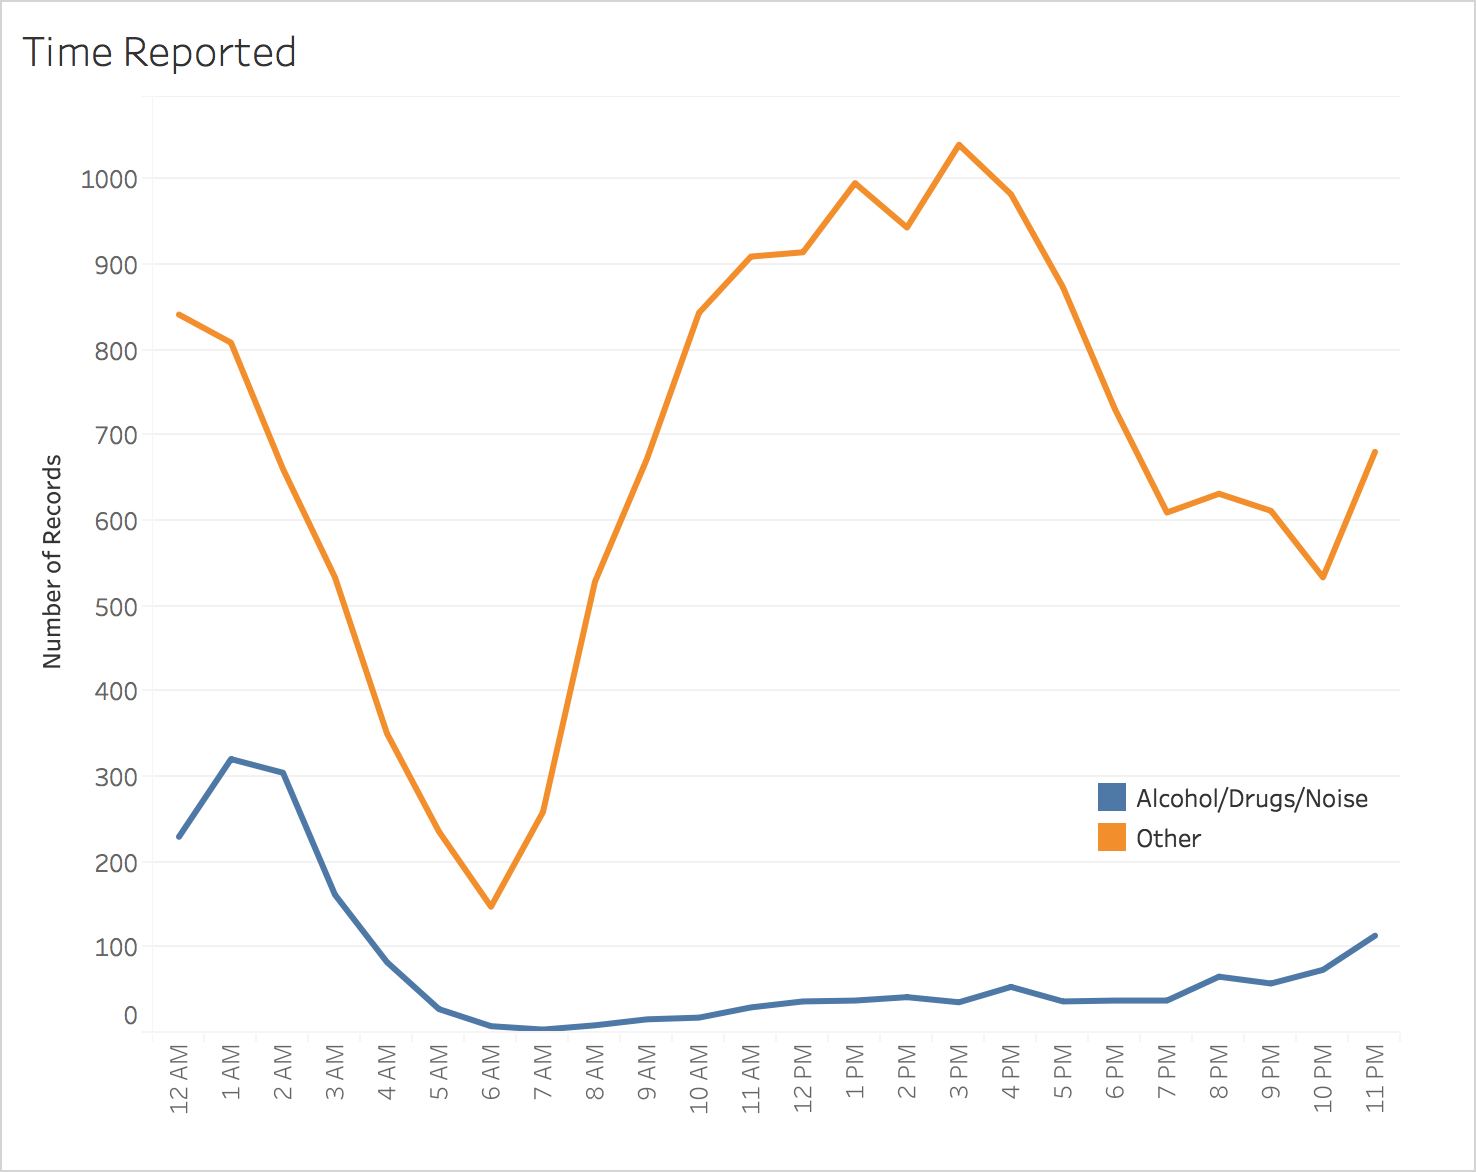
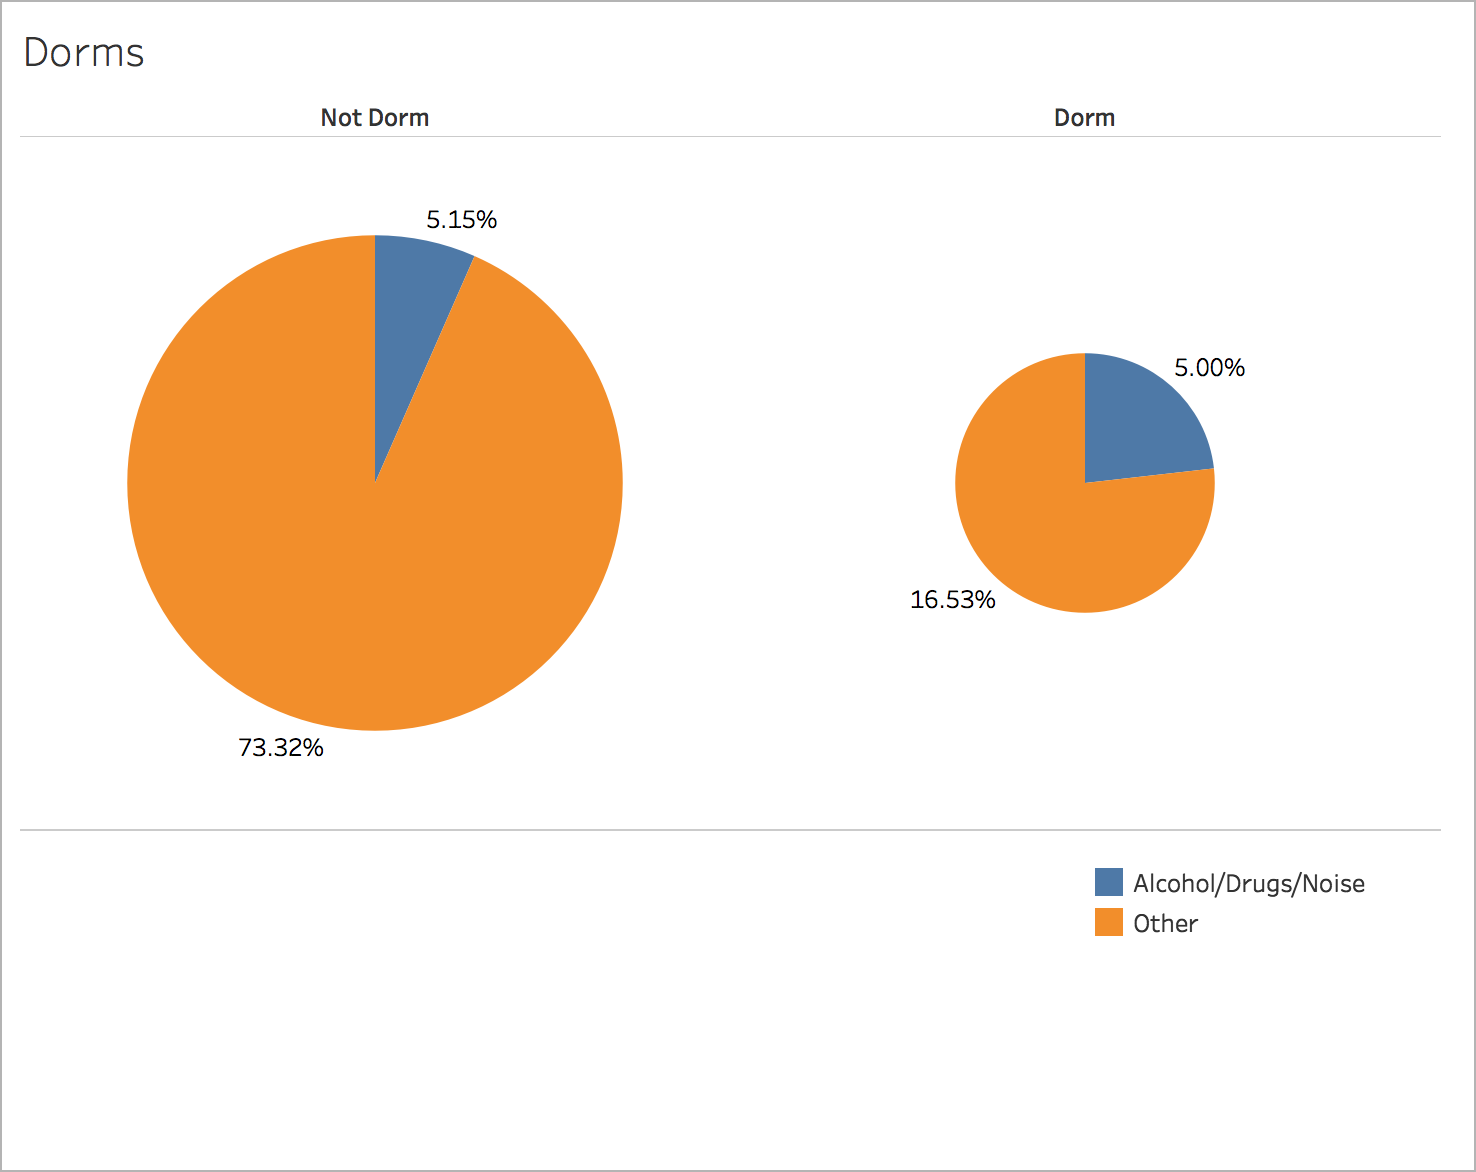
Incidents of the same type tend to be clustered in location and time.

NU Blotter uses the algorithm 1-nearest neighbor to classify incidents into two classes: Alcohol/Drugs/Noise and Other. The features it uses to predict these classes are month, day of the week, time, latitude, longitude, and whether the address is a dorm. Using these features, the model is able to predict whether the incident type is Alcohol/Drugs/Noise or not with 87.70% accuracy, although this metric is not necessarily ideal (see Model Selection). Using F1 score as a metric, 1-nearest neighbor strongly outperformed the baseline algorithms, as well as decision trees and logistic regression.

The Data

18,475 incidents from the Northwestern Campus Police Blotter

NU Blotter uses data scraped from the Northwestern Campus Police Blotter. Its dataset contains 18,475 incidents from 2006 to 2018. The raw data for date, time, and address had to be preprocessed before machine learning algorithms could be applied to it. The features I derived were:

  • Time of day (represented with sine cosine encoding to reflect the cyclic nature of time)
  • Day of the Week (as {-1, 1} one-hot encodings)
  • Month of the Year (as {-1, 1} one-hot encodings)
  • Latitude and Longitude (geocoded from address and scaled to mean=0, standard deviation=1)
  • Dorm (as {-1,1} for whether the address is a dorm)

The incident type provided in each blotter entry is very specific, with 125 different types of incidents specified. I initially grouped these into 16 categories. I excluded all incidents of type "General/Other" from the final dataset because this category seemed to included a mix of crimes from all the other categories, as opposed to defining a separate type of crime. In this way, it was only adding noise to the other categories. But I soon realized that I would need more data to achieve success predicting all 16 categories. Instead, I regrouped these categories into 2 classes:

  • Crimes associated with students (Alcohol/Drugs and Noise/Disturbances)
  • Everything else

The data also has to be cleaned to fix misspellings and to exclude locations outside of Evanston. After removing these data points and all data with incidents categorized as "General/Other", I had 12,441 records left. I saved 20% of these records as validation data and used the remaining 80% to select the machine learning model.

Data Exploration

Discovering Trends

Number of Incidents Reported vs. Month
Both categories of crime seem to fluctuate with the same pattern, peaking in the middle of each of the three main academic quarters and falling off in the months students are on break.

Number of Incidents Reported vs. Time of Day
Almost all alcohol/drug/noise related incidents occur late at night. Hardly any crimes occur in the early morning.

Number of Incidents Reported vs. Day of the Week
More alcohol/drug/noise related incidents occur on the weekends. The effect is especially strong on Saturdays.

Fraction of Incidents Reported in Dorms vs. Other Addresses
Alcohol/Drug/Noise related incidents make up a higher fraction of the incidents reported at dorms than other Evanston addresses.

Number of Incidents Reported by Location
Alcohol/Drug/Noise related incidents are mainly clustered in a few areas of Evanston.

Model Selection

Comparing Scikit-Learn models

To train a machine learning model on this data, I used the Scikit-Learn implementations of a few different machine learning models. I used 10-fold cross validation to compare their performance. I experimented with k-nearest neighbors, decision trees, and logistic regression. The data had high class imbalance, with only about 15% of records corresponding to alcohol/drugs/noise violations, and the remaining 85% belonging to the complementary classification. This meant that accuracy is not the ideal metric for comparing models, as a model that always guessed non-alcohol/drugs/noise could get 85% accuracy. Instead, I used the F1 score of each model to evaluate its performance. This gave an equal weighting to precision and recall. A summary of a few of the model's cross validation metrics are reported below, where "baseline" is zeroR for accuracy and random for precision, recall, and F1 score.

Algorithm Accuracy Precision Recall F1 Score
1-Nearest Neighbor 87.18% 56.30% 58.43% 57.25%
Decision Tree 87.05% 55.74% 58.30% 56.85%
2-Nearest Neighbors 87.83% 65.90% 36.25% 46.67%
Logistic Regression 86.66% 60.53% 27.48% 37.67%
Baseline 85.29% 15.03% 15.44% 15.23%

K-nearest neighbors with k = 1 gave the best performance using F1 as the metric, and significantly outperformed the baseline random classifier. This is the model I chose to deploy.

Evaluation

Measuring Performance on the Validation Set

When evaluating the 1-nearest neighbor algorithm on the validation data, the model had 87.70% accuracy (compared to a zeroR baseline of 84.63%). Although this result is significant with p = 0.0002 for a Fisher exact test, even more significant results can be found by examining the other metrics.

Algorithm Accuracy Precision Recall F1 Score
1-Nearest Neighbor 87.70% 59.31% 63.56% 61.36%
Baseline 84.63% 16.39% 15.96% 16.17%

The model achieved precision, recall, and F1 score which significantly outscored the baseline algorithms. This means that this model does much better than random guessing, and could provide officers with valuable information when predicting crime types.

Insights

Conclusions, What's Next

NU Blotter can be used to predict crime type of Northwestern Campus Police incidents based on the time and location of the incident. This could be useful to officers because it would allow them to respond to 911 calls faster, and could be used to plan patrols for future incidents. An interesting area of future work would be attempting to achieve similar levels of accuracy using small decision trees. This could make the model easier to interpret, perhaps giving the officers simple rules like "If it's after 9pm and you're North of Foster Street, the likelihood of alcohol related incidents increases." I would also be interested in speaking with a Northwestern Police officer to get their opinion on which types of crimes require the most distinct response profiles. Perhaps there are more useful predictions, such as violent vs. nonviolent, that would be more useful to an officer going into an unknown situation.